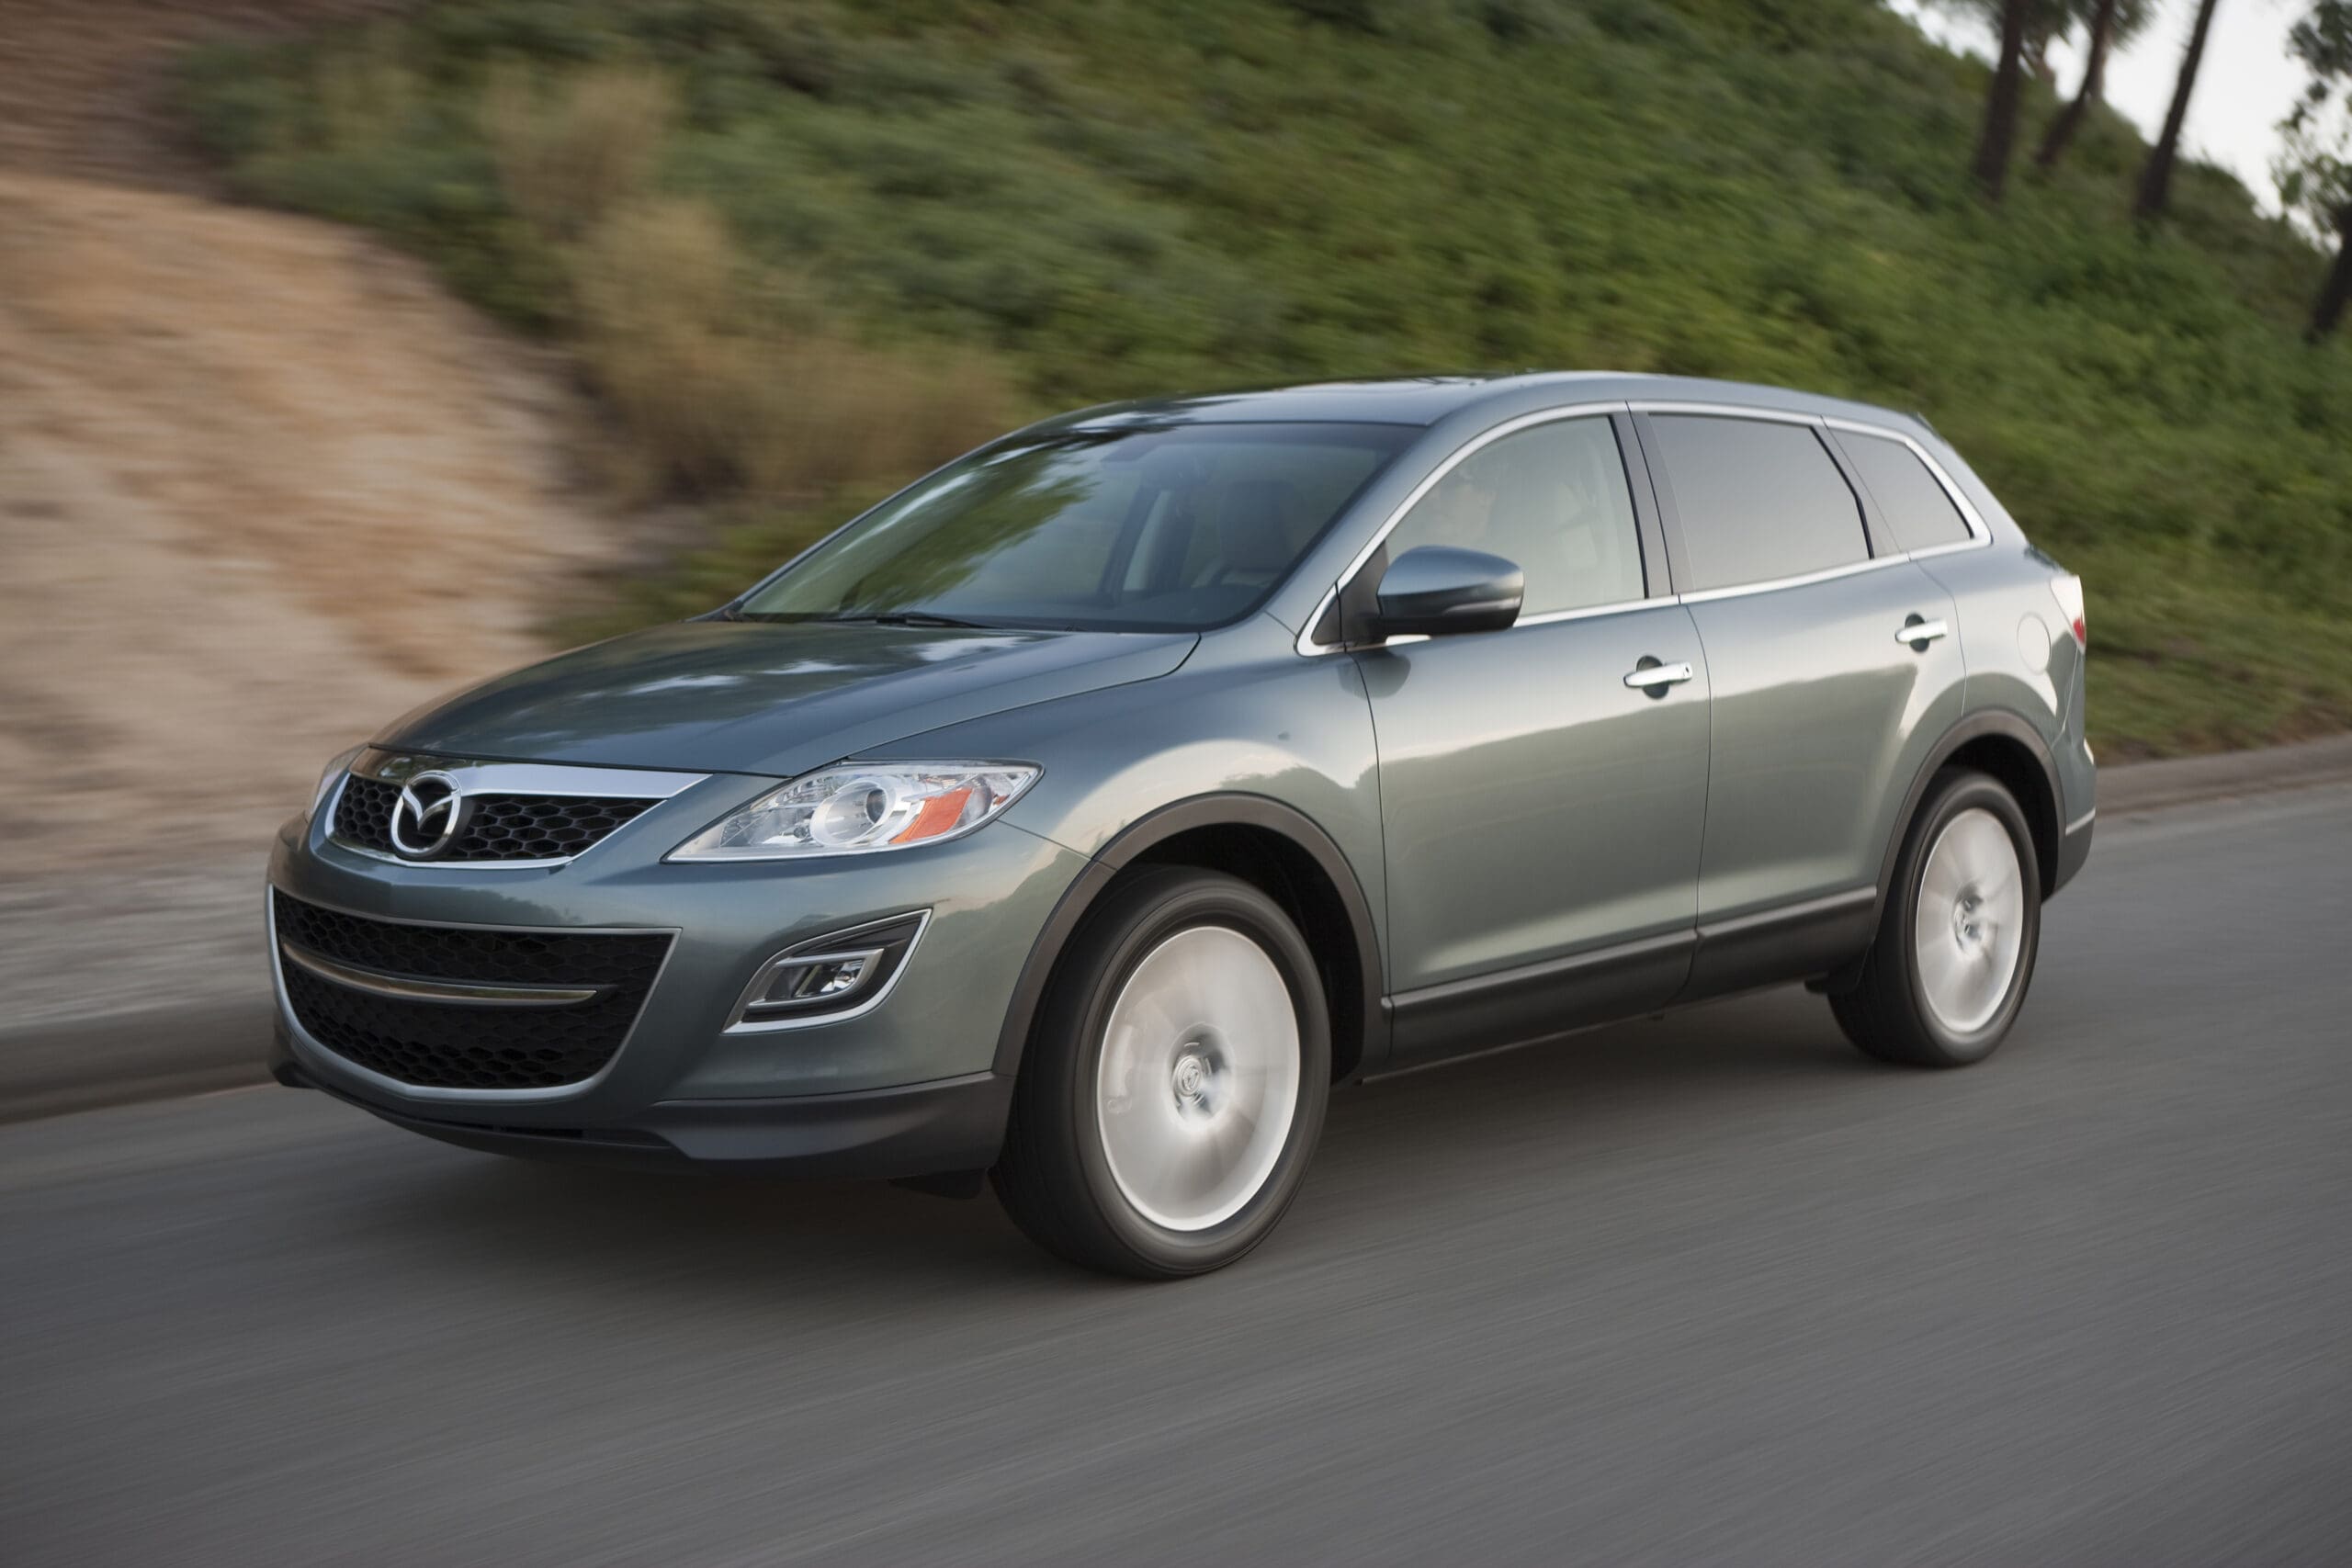
 Mazda SKYACTIV TECHNOLOGY accounts for more than half of total vehicle sales for the month of JulyIRVINE, Calif. — Mazda North American Operations (MNAO) today reported July U.S. sales of 19,318 vehicles, representing a decrease of 7.0 percent versus last year. Year-to-date sales through July are up 13.9 percent (13.9 percent DSR) versus last year, with 163,115 vehicles sold.
Key July sales notes:
- In the U.S., since the addition of the Mazda CX-5 to the SKYACTIV TECHNOLOGY vehicle line-up, SKYACTIV vehicle sales have increased from 24.0 percent (February 2012) to 60.0 perecent of total vehicle sales for the month of July.
- MX-5 Miata continued to stay hot this Summer with an increase of 3.7 percent over July of 2011.
Mazda Motor de Mexico (MMdM) reported July sales, of 1,942 vehicles, down 14.0 percent versus July of last year.
Mazda North American Operations is headquartered in Irvine, Calif., and oversees the sales, marketing, parts and customer service support of Mazda vehicles in the United States and Mexico through more than 700 dealers. Operations in Mexico are managed by Mazda Motor de Mexico in Mexico City.
For more information on Mazda vehicles, visit the online Mazda media center at www.mazdausamedia.com. Product B-roll may be ordered online by visiting The News Market at www.thenewsmarket.com/mazda.
| Month-To-Date | Year-To-Date | ||||||||||||||
| Jul | Jul | % | % MTD | Jul | Jul | % | % YTD | ||||||||
| 2012 | 2011 | Change | DSR | 2012 | 2011 | Change | DSR | ||||||||
| Mazda2 | 905 | 1,072 | (15.6)% | (8.8)% | 11,056 | 8,512 | 29.9% | 29.9% | |||||||
| Mazda3 | 9,027 | 9,288 | (2.8)% | 5.0% | 68,554 | 60,832 | 12.7% | 12.7% | |||||||
| Mazda5 | 994 | 1,186 | (16.2)% | (9.5)% | 7,939 | 12,967 | (38.8)% | (38.8)% | |||||||
| Mazda6 | 1,289 | 2,543 | (49.3)% | (45.3)% | 26,658 | 18,115 | 47.2% | 47.2% | |||||||
| MX-5 Miata | 590 | 569 | 3.7% | 12.0% | 4,016 | 3,654 | 9.9% | 9.9% | |||||||
| RX-8 | – | 65 | (100.0)% | (100.0)% | 80 | 544 | (85.3)% | (85.3)% | |||||||
| CX-5 | 4,208 | – | N/A | N/A | 20,239 | – | N/A | N/A | |||||||
| CX-7 | 324 | 3,152 | (89.7)% | (88.9)% | 10,983 | 18,738 | (41.4)% | (41.4)% | |||||||
| CX-9 | 1,979 | 2,640 | (25.0)% | (19.0)% | 13,087 | 18,179 | (28.0)% | (28.0)% | |||||||
| Tribute | 2 | 268 | (99.3)% | (99.2)% | 503 | 1,621 | (69.0)% | (69.0)% | |||||||
| Total Vehicles | |||||||||||||||
| CARS | 12,805 | 14,723 | (13.0)% | (6.1)% | 118,303 | 104,624 | 13.1% | 13.1% | |||||||
| TRUCKS | 6,513 | 6,060 | 7.5% | 16.1% | 44,812 | 38,538 | 16.3% | 16.3% | |||||||
| TOTAL | 19,318 | 20,783 | (7.0)% | 0.4% | 163,115 | 143,162 | 13.9% | 13.9% | |||||||
| MEMO: | |||||||||||||||
| IMPORT CAR | 11,516 | 12,180 | (5.5)% | 91,645 | 86,509 | 5.9% | |||||||||
| IMPORT TRUCK | 6,511 | 5,792 | # | 12.4% | 44,309 | 36,917 | 20.0% | ||||||||
| IMPORT TOTAL | 18,027 | 17,972 | 0.3% | 135,954 | 123,426 | 10.2% | |||||||||
| DOMESTIC CAR | 1,289 | 2,543 | (49.3)% | 26,658 | 18,115 | 47.2% | |||||||||
| DOMESTIC TRUCK | 2 | 268 | (99.3)% | 503 | 1,621 | (69.0)% | |||||||||
| DOMESTIC TOTALS | 1,291 | 2,811 | (54.1)% | 27,161 | 19,736 | 37.6% | |||||||||
| Selling Days | 25 | 27 | 180 | 180 | |||||||||||
SOURCE Mazda North American Operations


